Welcome to Planet Leatherback
By Bryan P. Wallace, Helen Bailey, Scott R. Benson, Kara Dodge, Peter H. Dutton, Karen L. Eckert, Sabrina Fossette, Michael C. James, Milagros López-Mendilaharsu, Nathan J. Robinson, Kartik Shanker, George L. Shillinger, Adhith Swaminathan, Manjula Tiwari, and Matthew Witt

A leatherback dives in the clear waters of Maluku, Indonesia. Leatherbacks inhabit vast oceanic ranges—more so than any other turtle species—as evident in the maps in this article. © Jason Isley / Scubazoo
The first SWOT Report maps in 2006 showed the global distribution of leatherback nesting, but they did not attempt to draw lines around the species’ distribution across our blue planet. So what more can nearly 20 years of additional data—including hundreds of satellite tracks and tens of thousands of nests counted—tell us? As you’ll see in the updated maps in the pages of this 18th volume of SWOT Report (pictured below), the more beaches we walk and the more turtles we tag and track, the more we see that leatherbacks really are … everywhere.
In fact, instead of describing where leatherbacks are, perhaps it is more appropriate to ask where they aren’t. We’ve got just the map for that: the funky, Antarctica-focused telemetry map below provides a novel perspective of the world’s one big, interconnected ocean that is centered around the one place that leatherbacks are apparently absent. The South Pole seems to be encircled in an anti-leatherback force field, successfully repelling any attempt by these otherwise intrepid explorers. Similarly, a leatherback-free zone fringes the frigid waters ringing the North Pole. Although their ability to stay warm in cold waters while chowing down on jellyfish is well known, even mighty leatherbacks cannot withstand icy polar seas.
Apart from those gaps, leatherbacks are truly circumglobal—more so than any other sea turtle species. Leatherbacks regularly travel back and forth between the tropics and subpolar latitudes, connecting distant ocean areas in a way very few species ever have in Earth’s history. For example, nearly 100 leatherbacks tracked from Papua Barat, Indonesia, and the U.S. West Coast over the past couple of decades show epic trans-Pacific migrations between breeding areas in warm near-equatorial waters in the west and feeding areas in the cold, foggy California Current in the east, several thousand miles apart. Meanwhile, other turtles from this nesting population take different paths into the South China Sea, to oceanic convergence areas north of Hawaii, and even as far afield as Tasmania and New Zealand. Overall, the North Pacific Ocean in these maps seems to feature more cells that have hosted leatherback action at some point than empty blue spaces.

Satellite telemetry data are represented as polygons that are colored according to the number of locations within each hexagon. Darker colors represent a higher number of locations, which can indicate that a high number of tracked turtles were present in that location or that turtles spent a lot of time in that location. Telemetry data are displayed as given by the providers, with minimal processing to remove locations on land and visual outliers, and represent almost 150,000 animal locations. Some tracks are raw Argos or GPS locations, whereas others have been more extensively filtered or modeled. For details on datasets and providers, please see the complete data citations.
In the South Atlantic, movements of leatherbacks from three different regional management units (RMUs, see “A New Coat of Paint for Sea Turtle RMUs”) connect the South American and African continents, stretching like chewing gum between what was once a single landmass in the southern hemisphere. Leatherbacks in the Northwest Atlantic are known to use the entire basin—from the Caribbean to Newfoundland to Mauritania to the Mediterranean—moving from bloom to bloom of ephemeral jellyfish prey like waterborne butterflies foraging among flower patches in the summer.
Recent data from the Indian Ocean provide a new flavor of the well-established leatherback recipe for long-distance movements connecting far-reaching corners of ocean basins. Instead of all following a shared trajectory, leatherbacks leaving nesting areas in the Andaman Islands in the northeastern Indian Ocean initially travel south and spread out in two directions—mainly southwest toward the eastern coast of Africa and southeast toward the northwestern coast of Australia and the Timor Sea—providing a near mirror image of the diverse navigations of West Pacific turtles from Indonesia, Papua New Guinea, and the Solomon Islands.
Although leatherback movement data paint with a broad brush across the blue ocean canvas, they paint thinly. Compared with other species, leatherbacks lack obvious hotspots where many of them tend to hang out. Most grid cells across the ocean have at least a few leatherback locations, but very few cells have high concentrations of location data—with a few notable exceptions near nesting beaches and places like New England, U.S.A., and Nova Scotia, Canada. Eastern Pacific leatherbacks represent this pattern well. More than 50 turtles tracked from nesting beaches in Mexico and Costa Rica over two decades showed a persistent migration stretching southwest through the Galápagos Islands before fanning out in the southeastern Pacific, their migratory corridor dissolving into the open ocean. Tracks from large juveniles and adults tagged in feeding areas off the coasts of Peru and Mexico have shown similar divergence.
Mapped telemetry data help us visualize where turtles go so that we can whittle down the vast expanse of Planet Ocean to, theoretically, more manageable areas of importance for turtles. With our surreptitiously attached our trackers, turtles themselves unwittingly disclose to us where they are in the world with each connection between transmitter and satellite. Using the rich but imperfect information we obtain through these spy games, we become Dermochelys detectives, trying to unravel mysteries about leatherback behaviors and hangouts we rarely—if ever—see for ourselves.
But as much as we’ve learned about leatherback movements and habitat use thanks to the bewildering evolution of remote tracking technology, we grudgingly recognize that these fancy tools provide only brief and biased snapshots of what turtles really do and—most importantly—why they do these things. Transmitters typically last a few months, with best-case scenarios pushing a year or slightly more; yet improvements in design and miniaturization are enabling the tracking of smaller turtles, even yearling juveniles. In addition, the majority of data shown in the maps on these maps and described in the data citations (which does not reflect all the global tracking data for this species) come from adult females leaving their nesting beaches in search of food in far-off waters. The movements of males, smaller juveniles, and hatchlings remain largely invisible to our lens, although genetic and oceanographic modeling tools have begun to shed some light on these missing pieces. Perhaps a more complete map that accounted for those caveats would leave no patch of open ocean between the Arctic and Antarctic untouched by a leatherback flipper.
Though leatherbacks dare to swim in waters inhospitable to their cheloniid cousins, their nesting sites are still constrained to low latitudes where favorable nest conditions exist, just like those of other sea turtles. As recently as a decade ago, the Northwest and Southeast Atlantic leatherback RMUs appeared to be abundant and stable, buoying hope for leatherbacks globally amid consistently bad news from the West and East Pacific RMUs.
Although there are fewer leatherbacks now than when we started counting, the good news is that leatherbacks are persisting almost everywhere, and our increased understanding of how they move through the oceans makes us better equipped to protect them. However, most leatherback populations are not increasing in abundance, and few are sufficiently large to withstand significant threats. So wherever we work, let’s keep discovering and sharing details about where leatherbacks are and what they’re doing there. If we do, the version of the leatherback map that one day appears in SWOT Report, volume XXXVIII, will provide an improved and hopeful view of Planet Leatherback.
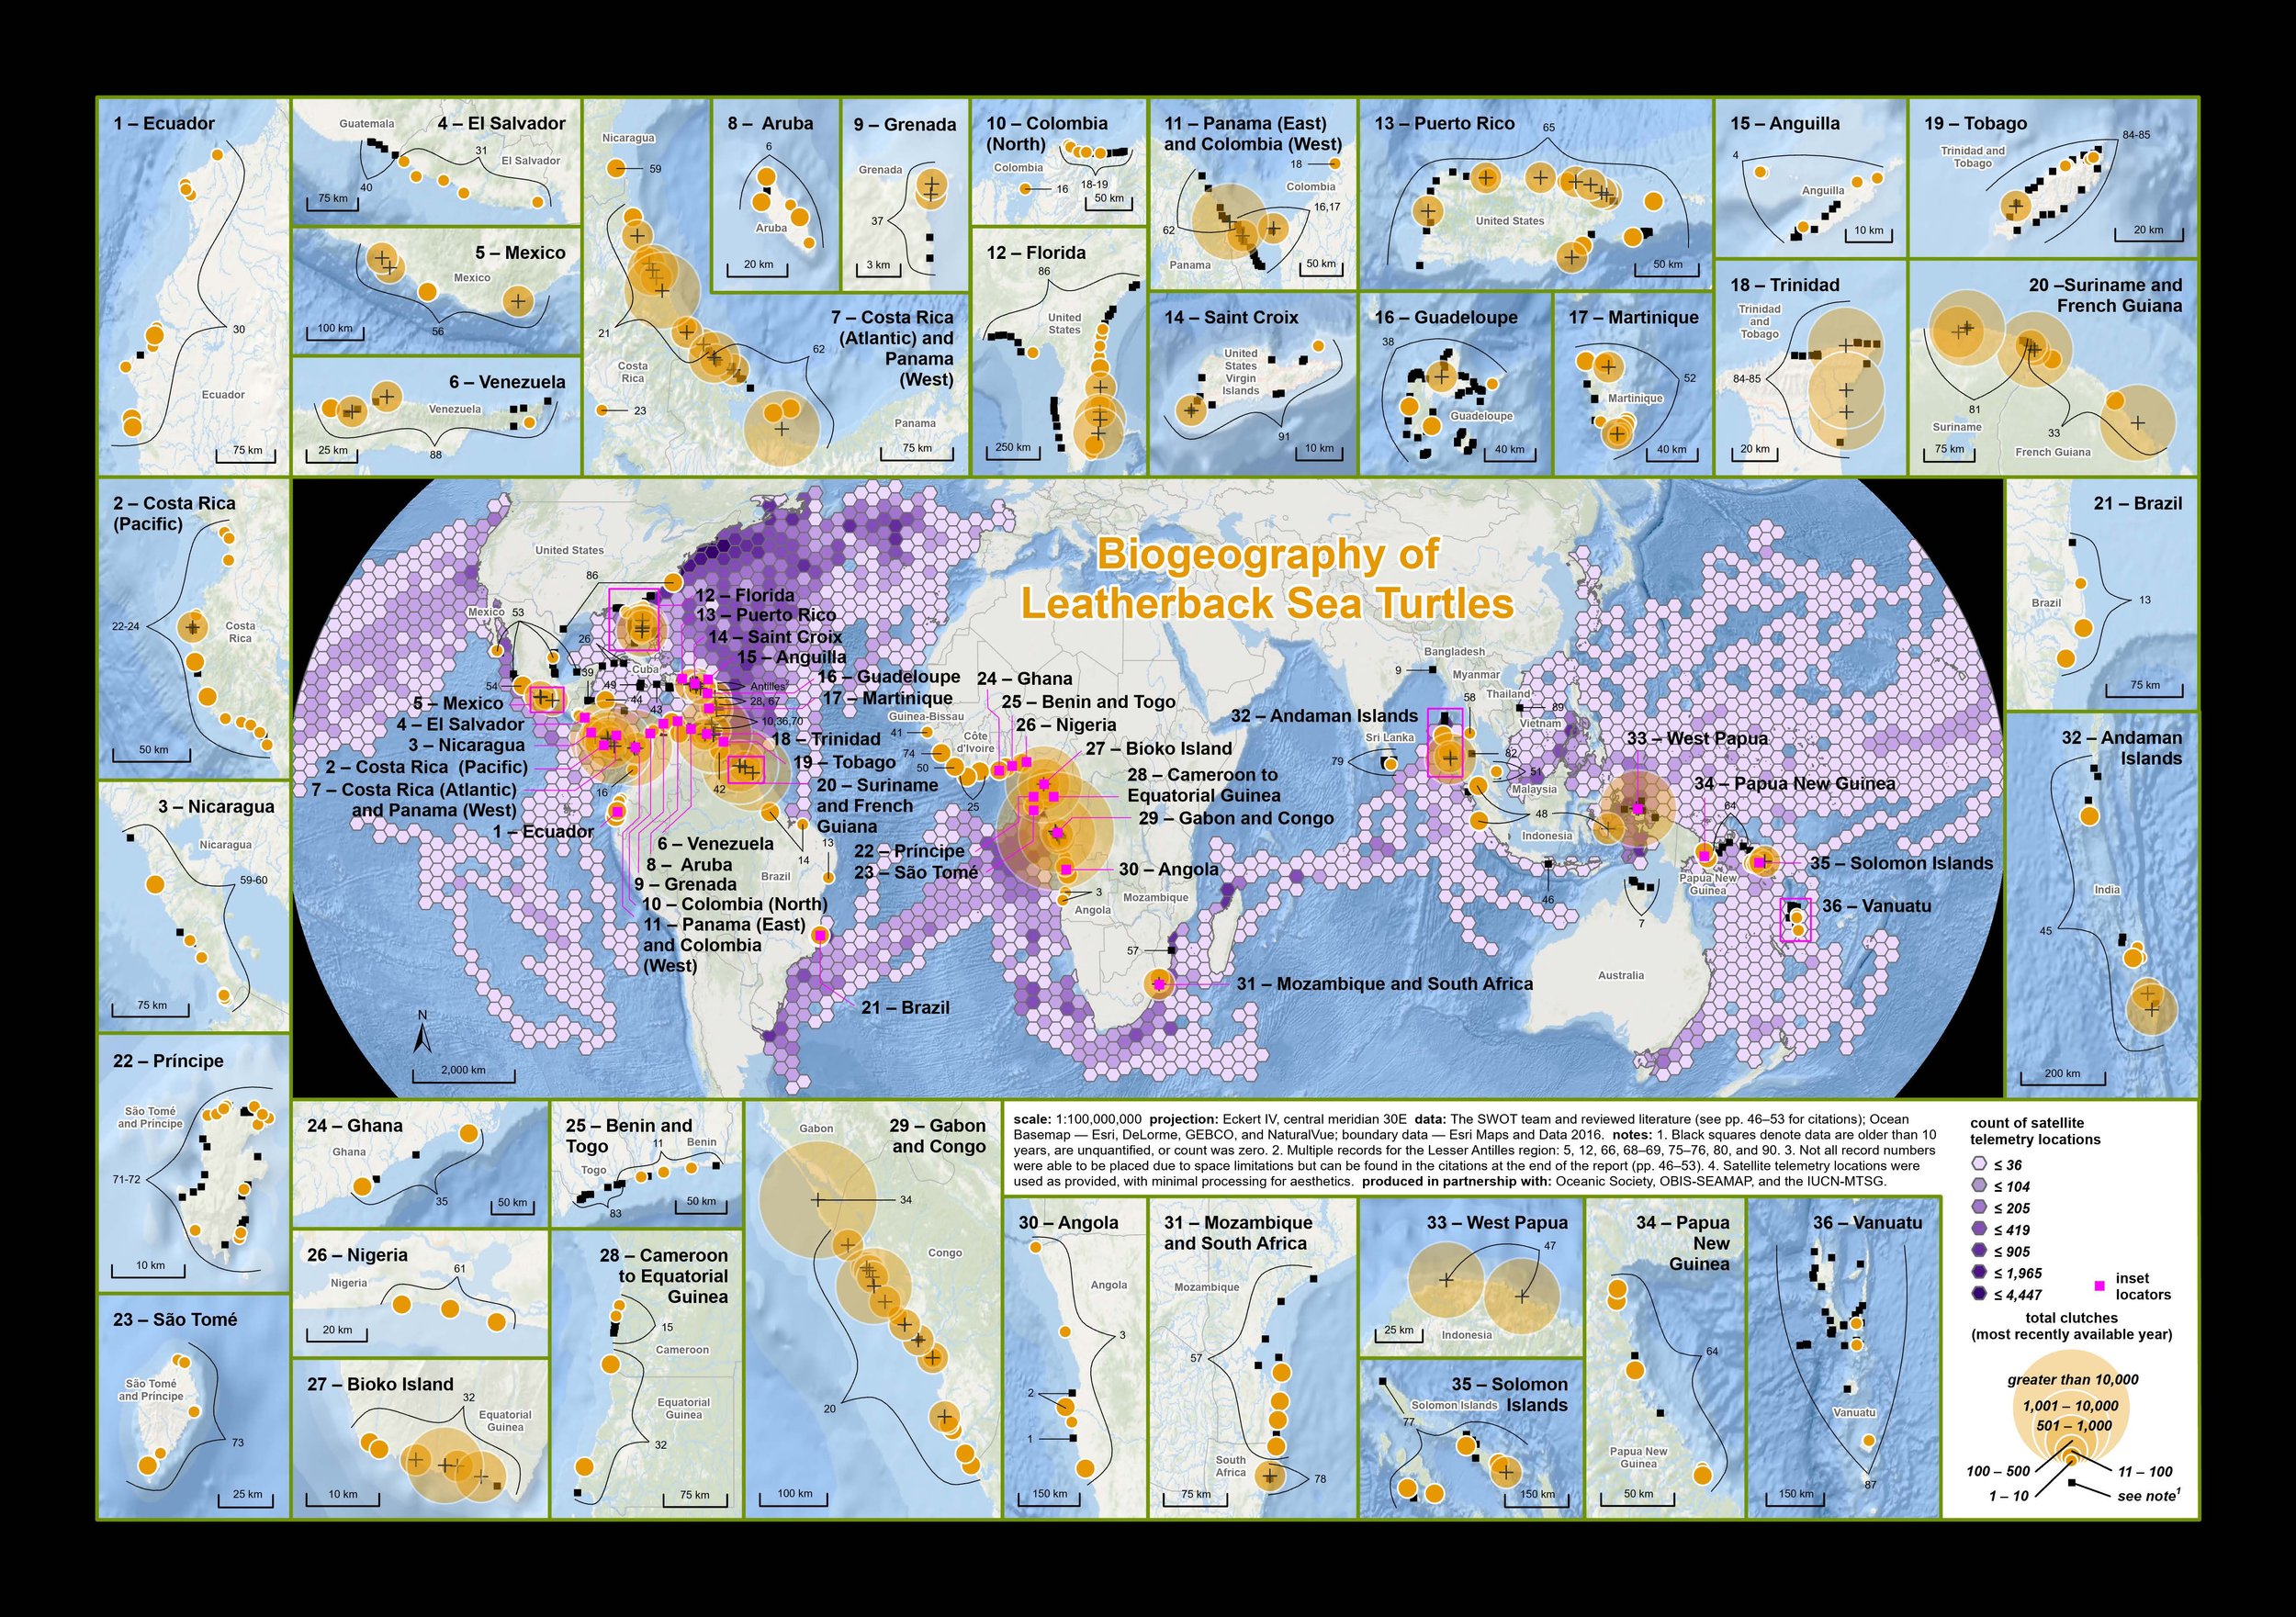
The maps above display available nesting and satellite telemetry data for leatherback sea turtles. The data include 988 nesting sites and 321 satellite tags, compiled through a literature review and provided directly to SWOT by data contributors worldwide. For metadata and information about data sources, see the data citations.
Nesting sites are represented by orange dots scaled according to their relative nesting abundance in the most recent year for which data are available. Black squares represent nesting sites for which data are older than 10 years, data are unquantified, or the nest count for the most recent year was given as zero. For the purposes of uniformity, all types of nesting counts (e.g., number of nesting females, number of crawls) were converted to number of clutches as needed. Conversion factors ranged from 4.1 to 6.4 clutches per female and 0.75 to 0.9 crawls per clutch.
Satellite telemetry data are represented as polygons that are colored according to the number of locations within each hexagon. Darker colors represent a higher number of locations, which can indicate that a high number of tracked turtles were present in that location or that turtles spent a lot of time in that location. Telemetry data are displayed as given by the providers, with minimal processing to remove locations on land and visual outliers, and represent almost 150,000 animal locations. Some tracks are raw Argos or GPS locations, whereas others have been more extensively filtered or modeled.
We are grateful to all of the data contributors and projects that participated in this effort. For details, please see the complete data citations.
This article originally appeared as part of a larger special feature on leatherbacks in SWOT Report, vol. 18 (2023). Click here to download the complete article as a PDF.